In older times, finding the cause for high bandwidth utilization was like finding a needle in a haystack, but in this digital era, there are a wide variety of tools available to monitor high bandwidth utilization and the cause. On those tools, Solarwinds NTA is standing apart from the crowd. Here, we will see what Solarwinds NTA is and how to use it to monitor and identify the root cause of high bandwidth utilization.
What is Solarwinds NTA?
Solarwinds NetFlow Traffic Analyzer is a NetFlow Analyzer and Bandwidth monitoring tool. NetFlow gives insights into the complete traffic with that we can monitor who or what is consuming the bandwidth to reduce the bandwidth usage. You can learn more about NTA and download the product from this link. NetFlow is cisco developed protocol to monitor traffic flow on their devices in a network. With this Netflow data, we can get the complete picture of traffic flow on the network. Other vendor has their own flow protocol; you can check the vendor documentation to know which protocol is used by non-Cisco devices. Also, NTA supports other flow protocols like NetFlow, J-Flow, sFlow, etc. To know more about the supported protocols and their versions by Solarwinds NTA click on this link.
Monitoring Bandwidth Utilization and NetFlow Data
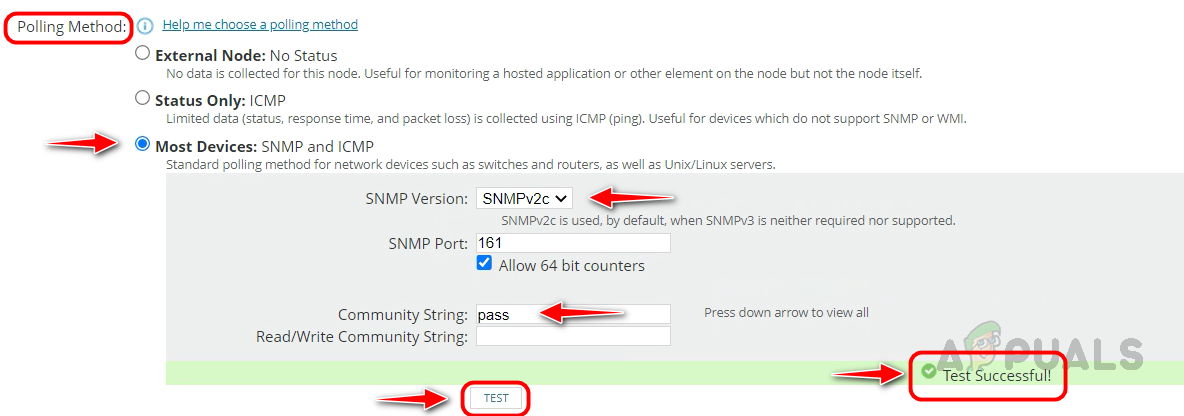
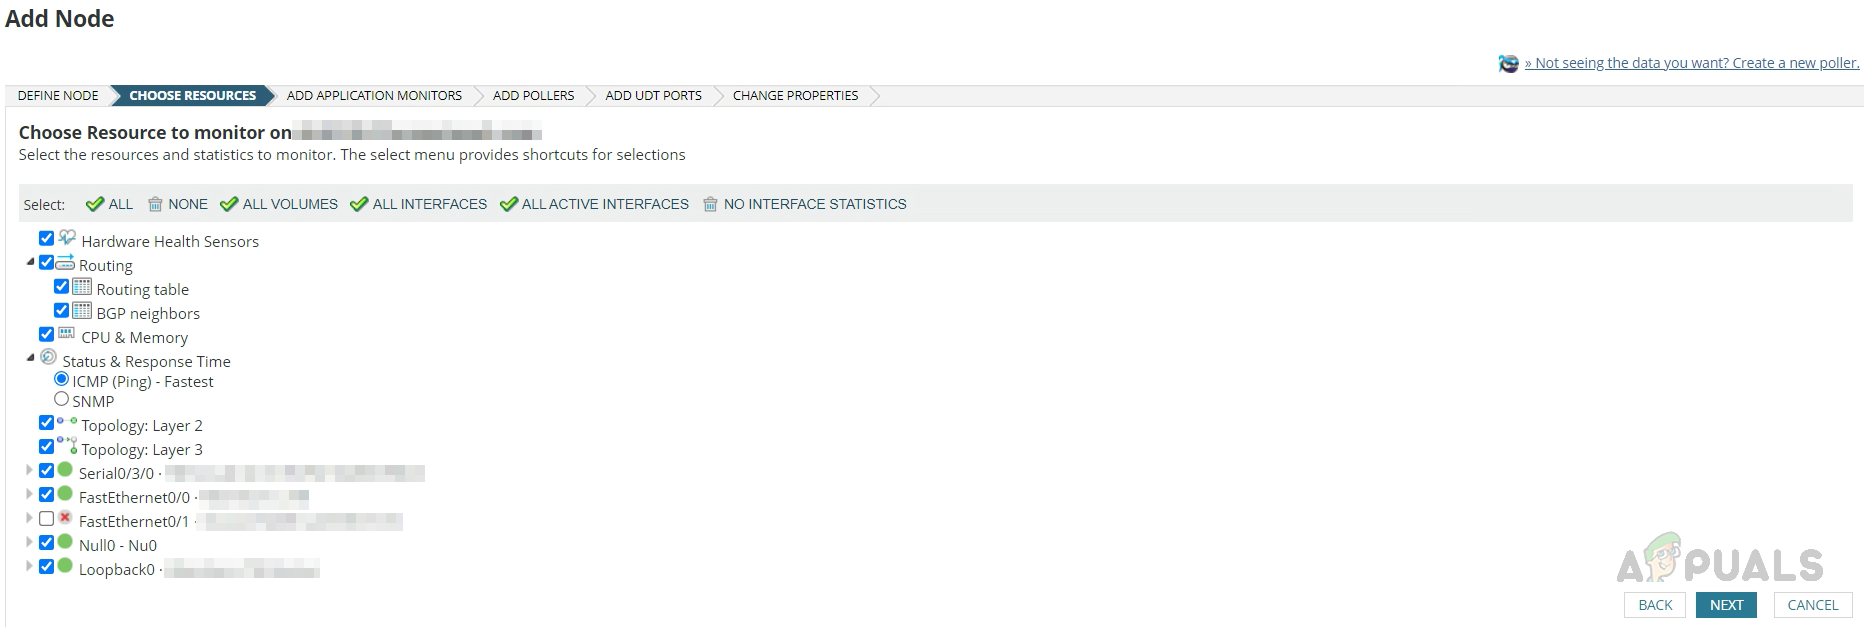
To monitor bandwidth utilization and NetFlow data using NTA, first, we need to add the node and respective interface to monitoring. Also, we need to enable NetFlow on the interface (protocol may vary based on the device vendor).
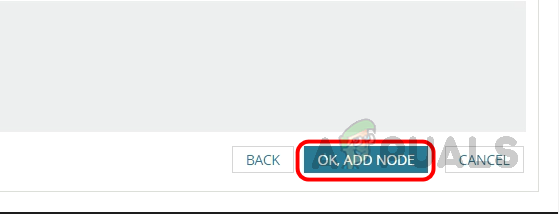
Adding Node and Interface to Monitoring
Enabling NetFlow on the Interface
Once the interface has been added to monitoring, we can see the bandwidth utilization data, but NetFlow needs to be enabled on the respective interface to get complete flow details. Let’s proceed with the below steps to enable NetFlow on a test Cisco Router and configure Solarwinds NTA to capture the flow details sent by the interface. Enable NetFlow only on the required interfaces to avoid any issues on the Network since enabling NetFlow on all interfaces will generate unwanted traffic, and it will store unwanted data outrun the storage of the Solarwinds database. We are done and ready. Now we are ready to capture the flow details using Solarwinds NTA.
Adding Interface to Flow Sources
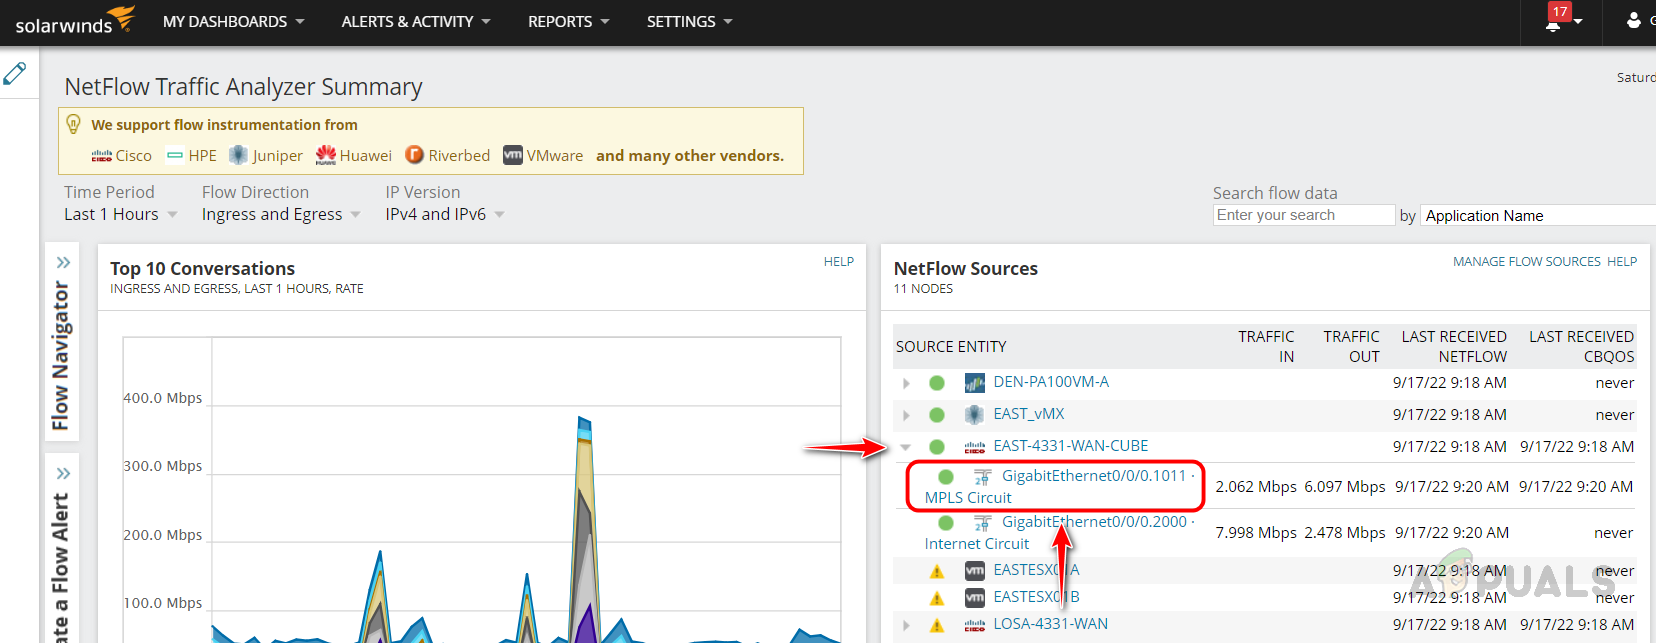
We have everything in place to monitor the interface’s bandwidth utilization and NetFlow data. Whenever we receive a high bandwidth utilization alert for this interface, we can identify the cause in Solarwinds NTA to fix this. Let’s see an example on how to check in Solarwinds NTA.
Identifying the Reason for High Bandwidth Utilization in NTA
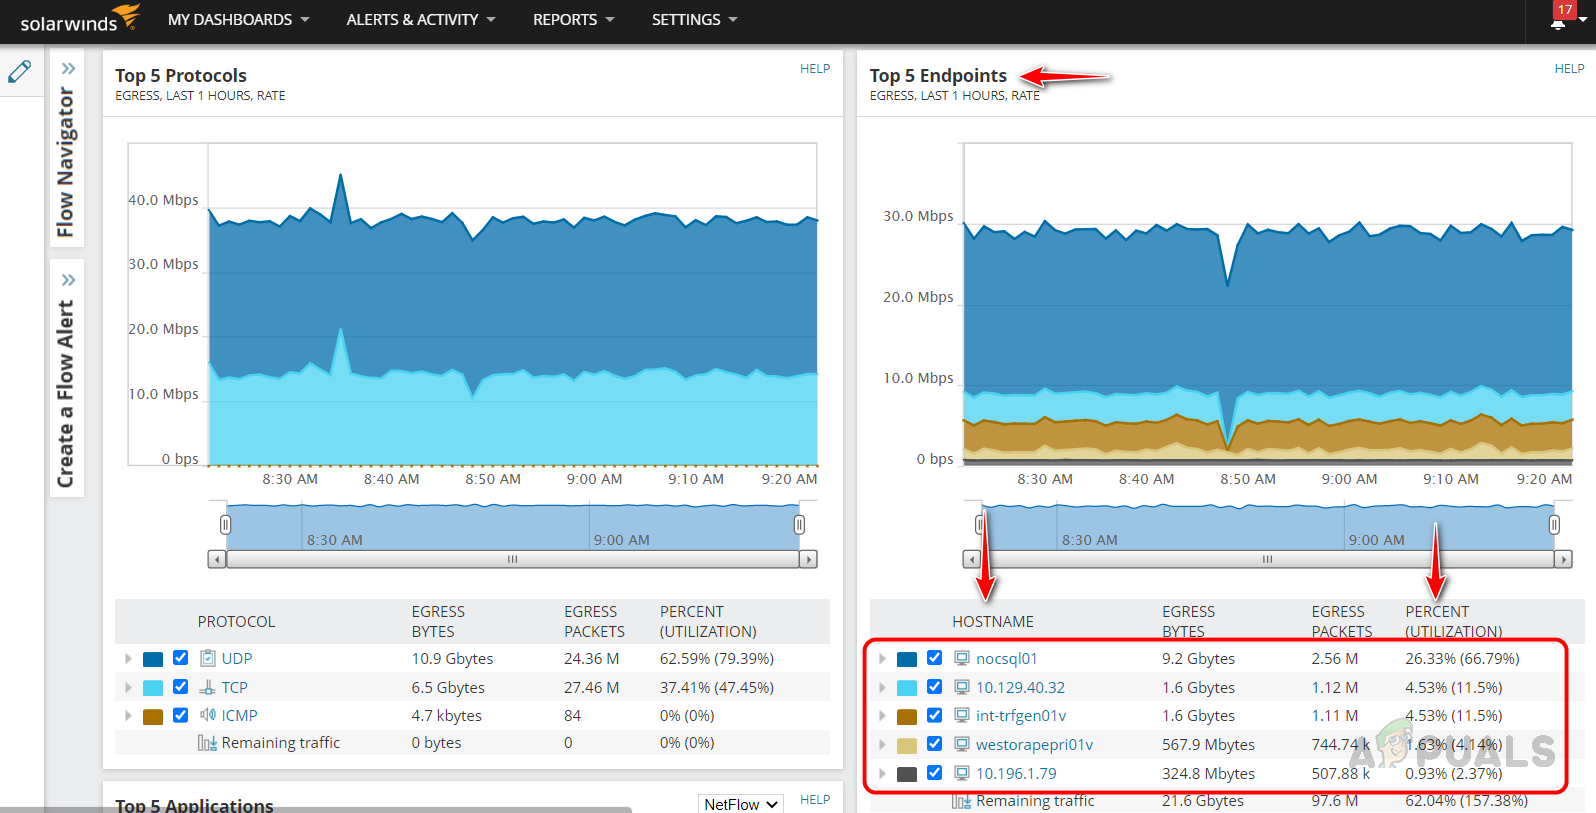
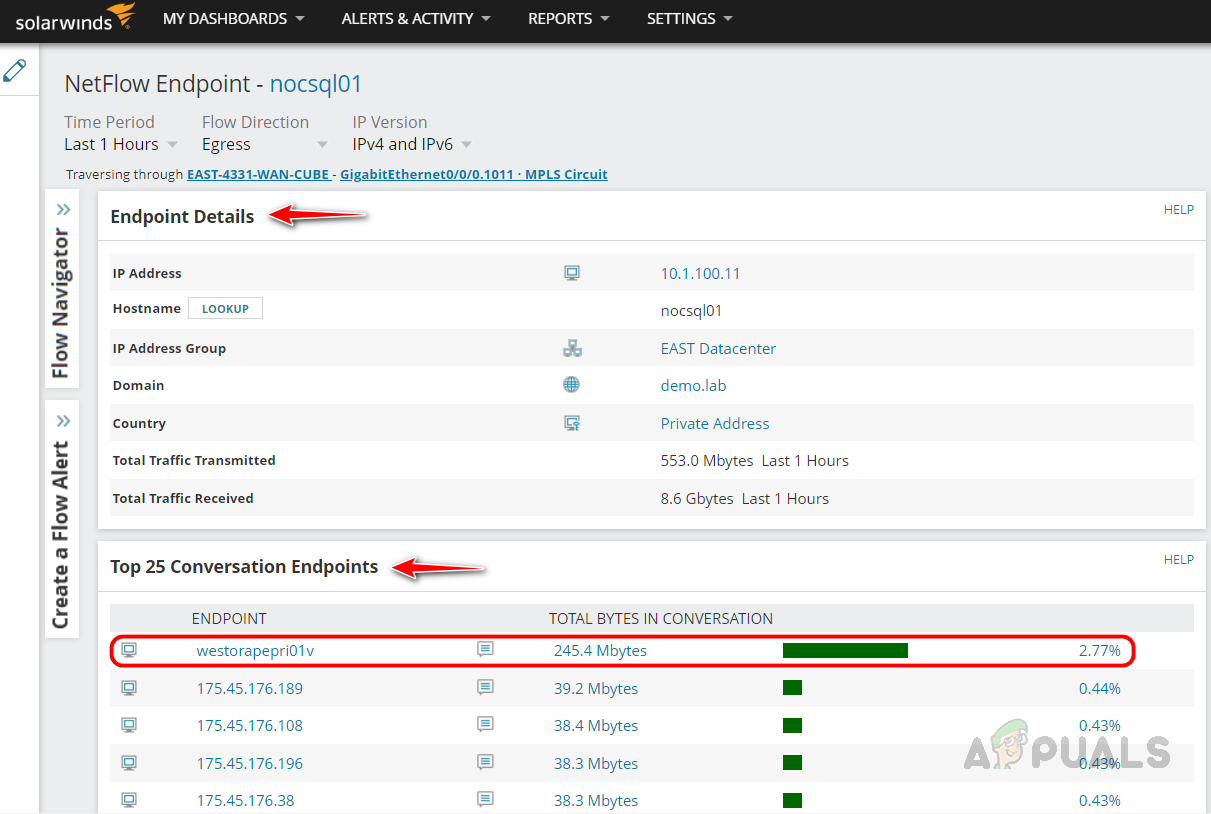
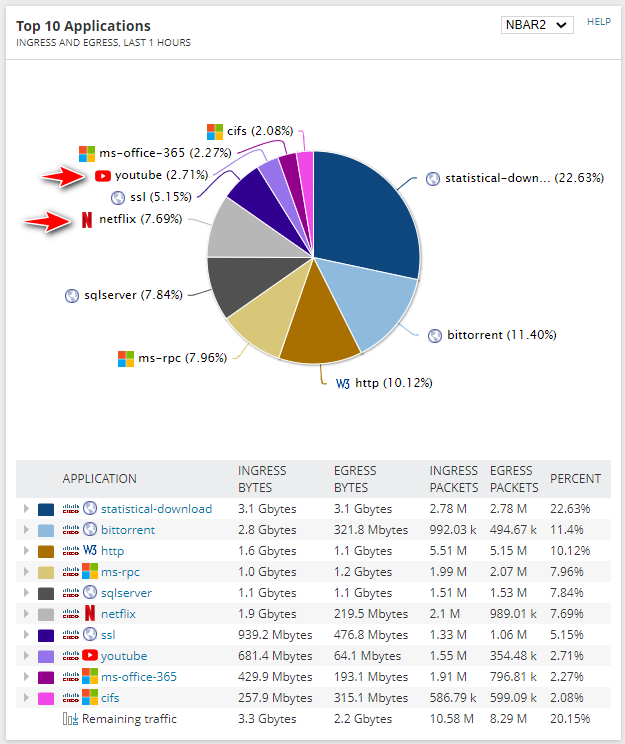
In this example, let’s assume we received a high bandwidth utilization alert for an MPLS interface from a router; let’s login into Solarwinds NTA. This is how we can use Solarwinds NTA in our day-to-day activities to identify the cause of the issue and fix them immediately to avoid any major issues. Solarwinds NTA also provides powerful reports and alerts; we can also use them to avoid any issues proactively.
How to Analyze and Monitor Memory Utilization in Realtime on Network Devices?How to Identify Free and In USE IP Addresses on your Network?AMD RDNA2 ‘Big Navi’ Graphics Cards Get ‘Infinity Cache’ To Reduce Latency And…Samsung Unveils GDDR6W Memory Offering 2x More Bandwidth And Capacity Over…


